
Inventory, Master Projects & SVG Maps
No matching results on this page
Try a different word, or clear the search box.
From a single standard listing to a full land-planning project with a clickable, color-coded plot map.
Menu: Properties
Every listing — a standalone apartment, villa, office, or land plot — starts the same way: Properties → Add New, then fill in type, category, area, price, size, images, floor plans, and facilities. This single record is the foundation everything else in this page builds on top of.
For a development with many units or plots — a compound, a land subdivision — one parent listing holds many child listings underneath it.
A parent listing of type Projects (a compound or development) holding many Villa listings underneath it — one price/size/status per unit, all organized under one parent record.
A parent listing of type Land Planning holding many individual Land plots underneath it — this is the type that unlocks the interactive SVG map, covered below.
Terminology note: "Land Planning" and "Projects" are the exact property type names as they appear in the system — use them when navigating, not generic terms like "master project."
Turn a flat land-planning drawing into a clickable, color-coded map — visitors click a plot to see its status and open its listing page directly.
1Upload SVG
On the parent (Land Planning / Projects) listing, click Add SVG map. Upload the .svg file and set its width/height.
2Add the Child Plots
Use Bulk Add to create the individual Land/Villa child listings this map will represent, each with its own L No. (Land Number).
3Click-to-Place Coordinates
Click Edit SVG, then click directly on the rendered map for each plot to capture its position, and enter its L No. to link it to the correct child listing.
4Live on the Public Site
Visitors see a color-coded, clickable map — status colors for available/sold/booked — and clicking a plot opens straight to its own listing page.
The SVG map only appears for parent listings whose type is Land Planning or Projects, and only once at least one child listing exists to link plots to.
If your SVG file doesn't follow this exact structure, plots won't be clickable — this isn't a style preference, it's how the map's code finds and links each shape.
Every clickable plot shape must sit inside one group element with the exact id="landmarks-map". Shapes outside this group aren't recognized as clickable plots.
Each individual plot shape, inside that group, needs its own id in the exact form prop-<L No.> — for example id="prop-12" for the plot whose L No. field is 12. This is what links the shape to the correct listing.
Real, working sample file
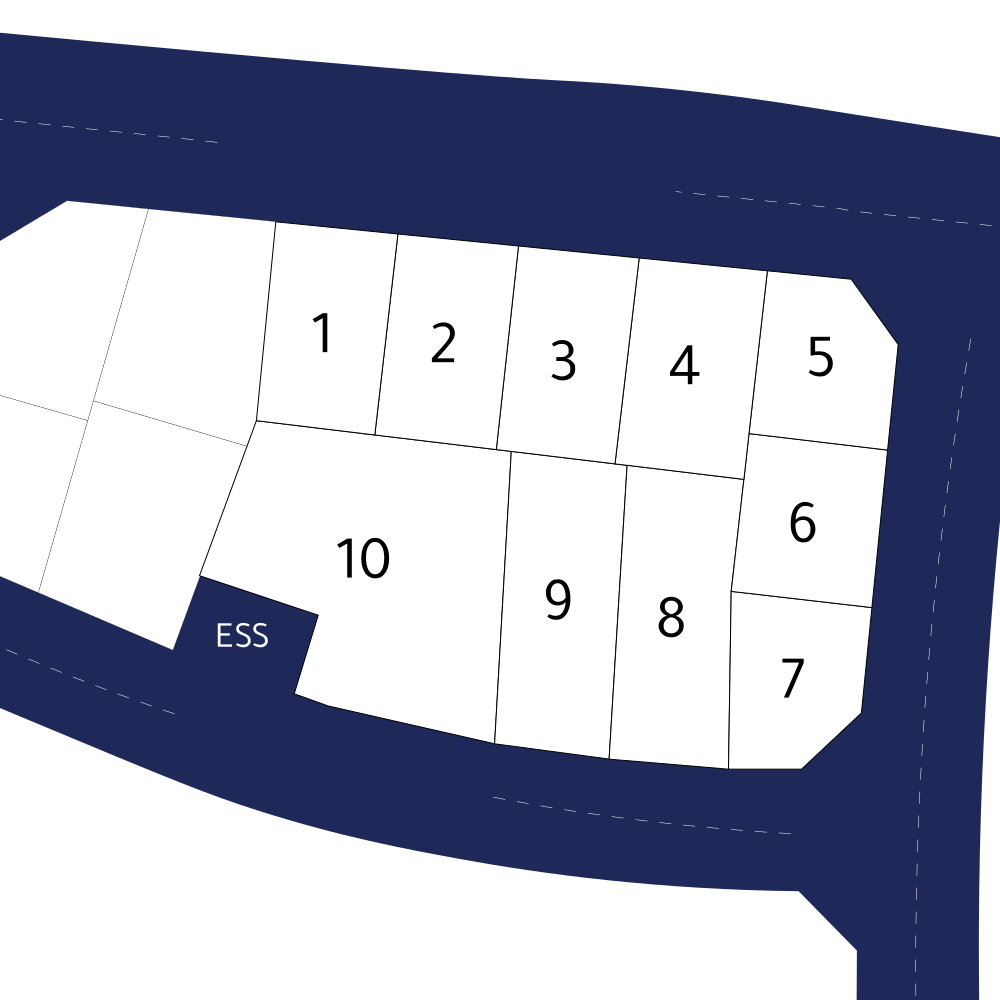
This file — land-plan-map.svg, 10 plots (prop-1 through prop-10) inside a single <g id="landmarks-map"> group — is a confirmed-working example. Open it in your vector editor to see the exact structure a designer should replicate: one landmarks-map group, each plot a direct child shape with a sequential prop-<L No.> id.
What this looks like in your vector editor's layers panel
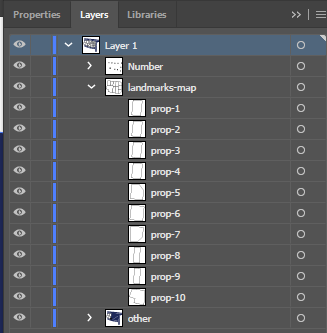
The SVG will include layers similar to the example below inside the vector editor (Illustrator, for example) — a landmarks-map group expanded to show each numbered plot as its own sub-layer, sitting alongside any decorative/background layers:
SVG code example
A trimmed excerpt of the sample file above — the part that actually matters. Everything else in the file (background art, labels, dimension lines) can be structured however you like; only this group and its child ids are load-bearing.
<!-- One group, exact id "landmarks-map" -->
<g id="landmarks-map">
  <!-- Each plot: a direct child shape, id = "prop-" + its L No. -->
  <polygon id="prop-1" points="397.9,234 374.8,435 256.4,420.7 275.8,221.8" />
  <polygon id="prop-2" points="518.5,246 496.3,449.6 374.8,435 397.9,234" />
  <polygon id="prop-3" points="639.2,258 615,463.9 511.3,451.4 496.3,449.6 518.5,246" />
  <!-- ...continues through prop-10... -->
</g>| Best practice | Why it matters |
|---|---|
| Use a real vector editor | Adobe Illustrator, Figma, or Inkscape all export clean, structured SVG — avoid tools that flatten shapes or strip ids. |
| Keep the file lean | Remove hidden or redundant elements, and discard details too small to actually see on the rendered map. |
| Simplify anchor points | Overly complex paths slow down rendering with no visible benefit — simplify curves before exporting. |
| Round coordinates | 1–2 decimal points of precision is plenty — extra digits only bloat the file size. |
Set every child plot's L No. before designing the SVG naming — that way you're naming shapes to match real, already-existing L No. values instead of guessing numbers in advance.