While various map formats are supported, SVG is usually the optimal choice for the following reasons:
- No quality loss upon zooming: unlike raster images, SVG vectors maintain sharpness even when zoomed in.
- Interactivity: listing360 can identify specific SVG elements, making them clickable and applying various styles for their base, hover, and active states.
SVG MAP compatibility
Any vector editor with built-in layer management can be used to prepare a map, for example, Adobe Illustrator, Figma or Inkscape.
Transform any SVG file into a listing360 compatible SVG by ensuring that the following criteria are met.
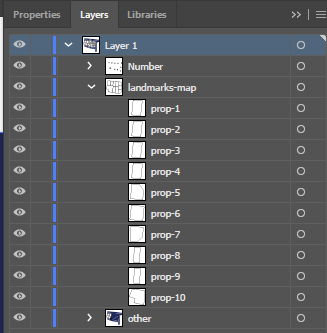
landmarks-map- group
Select all elements that should be interactive and Group them (Ctrl/Cmd + G in most editors), then name the group with “landmarks-map" (case sensitive).
The group id is essential for the listing360 to recognize elements as interactive.
Name elements
Each child within the “landmarks-map” group must have a unique ID that starts with “prop-” then the property ID (it should be same as the one in listing360).
Examples: prop-1, prop-2, prop-3, prop-4, prop-5
The SVG element will be linked to the property ID in the listing 360.
The SVG will include a layers similar to the below example inside the vector editor (illustrator for example)
The SVG will include a section with similar code inside the code editor (notepad for example)
					  <g id="landmarks-map">
    <polygon id="prop-10" class="st1" points="511.3 451.4 494.6 743.8 328.2 706 294.2 693.8 318.2 615.2 199.5 575.7 246.9 446.5 246.9 446.5 256.4 420.7 374.8 435 496.3 449.6 511.3 451.4"/>
    <polygon id="prop-9" class="st1" points="627.1 465.3 609.1 759.1 494.6 743.8 511.3 451.4 615 463.9 627.1 465.3"/>
    <polygon id="prop-8" class="st1" points="743.9 479.4 731.2 591.4 728.5 769.2 611.8 759.4 609.1 759.1 627.1 465.3 743.9 479.4"/>
    <polygon id="prop-7" class="st1" points="871.9 607.6 861.4 713 801.5 769.2 728.5 769.2 731.2 591.4 871.9 607.6"/>
    <polygon id="prop-6" class="st1" points="887.6 450.1 871.9 607.6 731.2 591.4 743.9 479.4 749 433.6 887.6 450.1"/>
    <polygon id="prop-5" class="st1" points="898.2 344.6 887.6 450.1 749 433.6 767.4 270.8 851.2 279.2 898.2 344.6"/>
    <polygon id="prop-4" class="st1" points="767.4 270.8 767.4 270.8 749 433.6 743.9 479.4 627.1 465.3 615 463.9 639.2 258 767.4 270.8"/>
    <polygon id="prop-3" class="st1" points="639.2 258 615 463.9 511.3 451.4 496.3 449.6 518.5 246 639.2 258"/>
    <polygon id="prop-2" class="st1" points="518.5 246 496.3 449.6 374.8 435 397.9 234 518.5 246"/>
    <polygon id="prop-1" class="st1" points="397.9 234 374.8 435 256.4 420.7 275.8 221.8 397.9 234"/>
  </g>
Optimization
Given that listing360 is a web application, it’s vital to ensure that the map file(s) remain lightweight and well-optimized. Uploading large files can have adverse effects on performance and loading times.
Achieving optimal SVG exports can be challenging, requiring a thorough understanding of the file format. Below, you’ll find a set of practices that can help you achieve the best results:
- Occasionally, elements are hidden or become invisible due to overlapping graphics. Ensure that you remove any redundant elements.
- Discard details that are imperceptible even when fully zoomed in.
- Sometimes, anchor points are excessively used, leading to unnecessary points in the graphic. You can manually remove them or use a shape simplify tool.
- When saving the file, be sure to include at least 1-2 decimal points, but don’t overuse them to prevent file size increase.
SVG Example file
download the below example file
